3.6: Experimental Results

Table 3.10, reports the experimental results for a lowpass filter. We required an attenuation of 1dB for the pass band, and 25dB for the rejection band. Further, we selected a sampling frequency equal to 10kHz, and a cutoff frequency of 1kHz. The bandwidth for the transition band is 500Hz. The input signal is a sinusoid with amplitude of 4V and a variable frequency in the range from 700 to 1700 Hz. The output filtered signal amplitudes are expressed in Volt. The number of poles is the minimum value necessary to match the specifications. Of course, selecting a higher number of poles, you can observe an improvement of the performance.
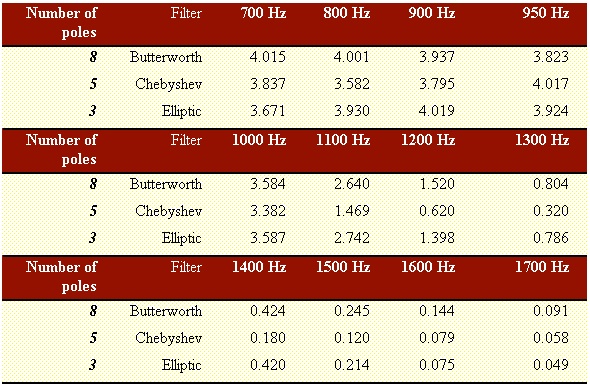
Table 3.10.
For the highpass filter case, the only specification we changed is the cutoff frequency: now the maximum frequency of the rejection band is 1000 Hz, while the lowest frequency of the pass band is 1500 Hz. Table 3.11 is an example of results from a Butterworth filter only.
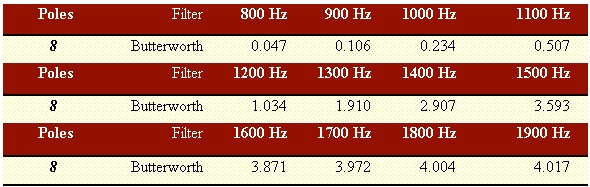
Table 3.11.
For the bandpass filter, the lower rejection band frequency is 1000 Hz, while the higher one is 2500 Hz. For the pass band, the lower and higher frequencies are 1500 Hz and 2000 Hz, respectively.
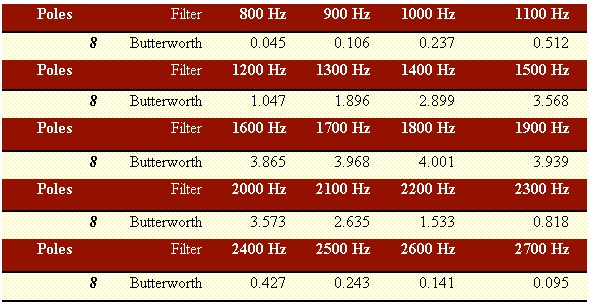
Table 3.12.
Similarly, for the bandstop filter we have the same frequencies values as for the bandpass filter. However, in this particular case we have to swap the roles of the pass band and rejection band.
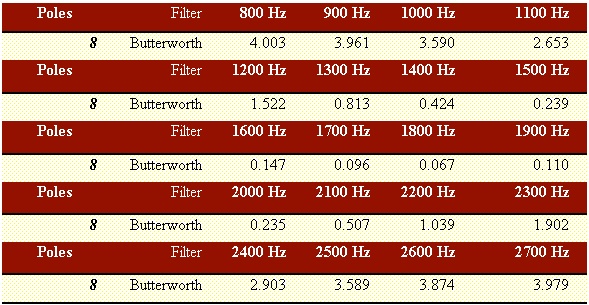
Table 3.13.